

"ROI" applied to virtual team building is one of the most misused phrases in HR vocabulary right now. Most calculations rely on engagement-survey deltas, NPS scores collected ten minutes after the event ends, or anecdotal "the team seemed more connected." Finance reads all three as morale spend with a returns-shaped wrapper. The real financial case — the one a CFO can defend in a quarterly review — runs through your HRIS, your attrition rate segmented by tenure band, and a cost-per-departure number that's been published every year for the past decade. The ROI question isn't whether the event was fun. It's whether the chain of measurements from baseline to 90-day retention holds up to scrutiny.
Five years into running virtual team building as a category — 1,500+ events for 300+ companies across 50+ countries — we've watched the failure modes repeat enough to predict most of them. The most common ROI miscalculation isn't malicious or even careless; it's that the wrong numbers got measured because the question got framed wrong from the start, and by the time Finance asks for the renewal case there's nothing rigorous to point to.
How do you calculate the ROI of virtual team building in a way that holds up to a Finance review six months later?
The four-stage ROI measurement playbook
Most HR leaders try to compute ROI after an event runs. By then the most important number is already gone — the pre-event baseline that converts post-event scores from "vibes" to "delta." A real ROI measurement starts roughly three weeks before the event with an explicit pre-event data pull, and ends around 90 days afterwards with a comparison against your initial benchmarks. Each stage below has an owner, a timing window, and a single deliverable. Skip a stage and the next one's outputs become un-citable.
Stage 1: Establish the baseline (3 weeks pre-event)
Owner: HR Leader with HRIS access
Timing: ~21 days before the event
Deliverable: baseline data sheet with three numbers
You need three baseline numbers before anyone joins a live session or a Marathon kicks off. First, your voluntary attrition rate by tenure band, with particular attention to the 6-to-18-month cohort where most connection-deficit quits happen. Second, your engagement survey variance by team and manager — not the company average, but the spread between your highest and lowest scoring pods. Third, a quick three-question pulse to whichever cohort you're running the event for: sense of connection, likelihood to recommend the company, intent to stay through the next year.
These three become your before-snapshot. Without them, the ROI calculation 60 days later has nothing to compare against, and the conversation defaults back to "did people seem to enjoy it?" — which is exactly the conversation you're trying to escape.
Stage 2: Choose the format for measurable outcomes (2 weeks pre-event)
Owner: HR Leader
Timing: finalised ~14 days out
Deliverable: format + game decision with projected participation rate
Format choice is the variable that most directly shapes which numbers you can defend later. A Big Game is one shared, contained event with a single participation rate, one NPS, and one leaderboard. Something like Apocalypse or Mission 8-Bit at 75-to-90 minutes delivers a tight data envelope: who showed up, how teams coordinated, what the post-event pulse looked like. For a team under 400 in a manageable time-zone band, that's the cleanest possible signal.
A Marathon spreads engagement across 1-to-5 days, with daily episodes players engage with on their own schedule. Each day you get a separate participation data point, a separate completion percentage, and a separate by-team breakdown. We see 65-to-78% completion rates on opt-in Marathons at 500+ companies, which beats most live events without the scheduling overhead. For distributed teams, or for the ROI conversation in particular, Marathon's denser data is the stronger proof footprint. Bureau of Magical Affairs, Wintervald Hotel Mystery, and Under the Big Top all run cleanly in Marathon format and produce by-team analytics across the multi-day arc.
Don't pick the game by what looks fun in a vendor catalog. Pick by which set of metrics you need to defend. If your team is under 90 days old as a unit, a stress-mechanic game like Apocalypse will score worse than its potential because the coordination baseline isn't there yet. If your team is two years in and bored of standard offsites, Stolen Hours at its genre-bending pacing usually outscores a safer choice. The format-game pair you choose is the lens through which the ROI numbers get refracted.
Stage 3: Capture the event-level proof signal (day of + 24 hours after)
Owner: HR Leader, supported by People Ops
Timing: the day of the event, plus the 24 hours after
Deliverable: event analytics report ready to file
The HeySparko analytics dashboard delivers participation rate, NPS by team, and engagement breakdown within 24 hours of the event. That's your event-level proof signal — the number a manager can use to explain to skip-level leadership what happened. Catch it while it's fresh. Most HR leaders we work with file the post-event analytics report inside a week so it sits pinned where the eventual Finance conversation will happen.
The detail most teams miss: file the data BY MANAGER, not just by company. Manager-mediated engagement variance is the strongest single predictor of retention in the research literature, and the data the team produced during the event maps cleanly onto that variance. The Slack-worthy moment three months later isn't the company-wide NPS. It's the team whose manager was in the bottom engagement quartile, but whose team showed up to the Marathon at 92% completion and posted the highest scores in the follow-up pulse. That's the chart you want when the renewal conversation arrives.
Stage 4: Connect to 60-to-90-day retention
Owner: HR Leader + HRIS
Timing: 60-to-90 days after the event
Deliverable: before/after comparison report
This is the stage that converts event analytics into actual ROI. Pull HRIS attrition data for the cohort that participated in the event, segmented by team. Compare against your Stage 1 baseline. Run a follow-up three-question pulse mirroring the one you ran pre-event. Compute the delta on each metric. The numbers will be modest after one event. Run the same playbook a second time and the delta begins to compound.
The math you bring to Finance: for a 300-person company with around $1 million in annual departure exposure (using mid-range $18 thousand cost-per-non-executive-departure figures across 60 voluntary departures per year), even a 10% reduction in turnover within the at-risk cohort represents $100 thousand in retained value. An engagement program at $20 thousand to $30 thousand annually clears that hurdle by 3-to-5x. We've watched this exact math get a first-time HR Leader a recurring annual program after a single quarter's results. BGaming ran a fully customized Big Game for their ~400-person distributed team and saw 89% participation with an 8.7 NPS — the kind of event-level data the People Ops team carried into the following budget cycle to justify a recurring annual engagement program. That's the proof footprint we're designing for.
What could go wrong

The framework above works when the data flows. Here's where the chain most often breaks in practice.
Skipping the pre-event baseline. This is the single biggest ROI-killer we see. Without baseline numbers there is no delta. Six months later when the CFO asks "what did we get from this?" you have anecdotes. Pull the three baseline numbers in Week -3 or accept that you won't have an ROI case. It is the most boring step in the playbook and the most important.
Conflating event NPS with retention impact. A 9.1 NPS at the event itself is a participation signal, not a retention signal. The retention signal lives in your 60-day HRIS pull, not in the post-event survey. Both data points belong in the ROI narrative; don't pretend the event score is the whole story. Finance can tell when one number is doing the work of three.
Picking a format that doesn't generate the data you need. A single 60-minute icebreaker run for 40 people gives you one data point. A 3-day Marathon for 200 gives you three days of participation data, three episode-level NPS pulses, manager-level completion breakdowns, and a much richer foundation for the retention argument. Marathon's data density is one of its under-appreciated benefits, and for ROI work it usually beats Big Game's cleaner-but-thinner data envelope.
Running the event in a quarter with confounding variables. If you're running a stretch reorg, a layoff, an HRIS migration, AND your engagement event in the same quarter, you can't isolate the event's contribution to whatever happens to retention. Pick quieter operational windows for the events whose data you most need to defend, or accept that the ROI case will be directional rather than precise.
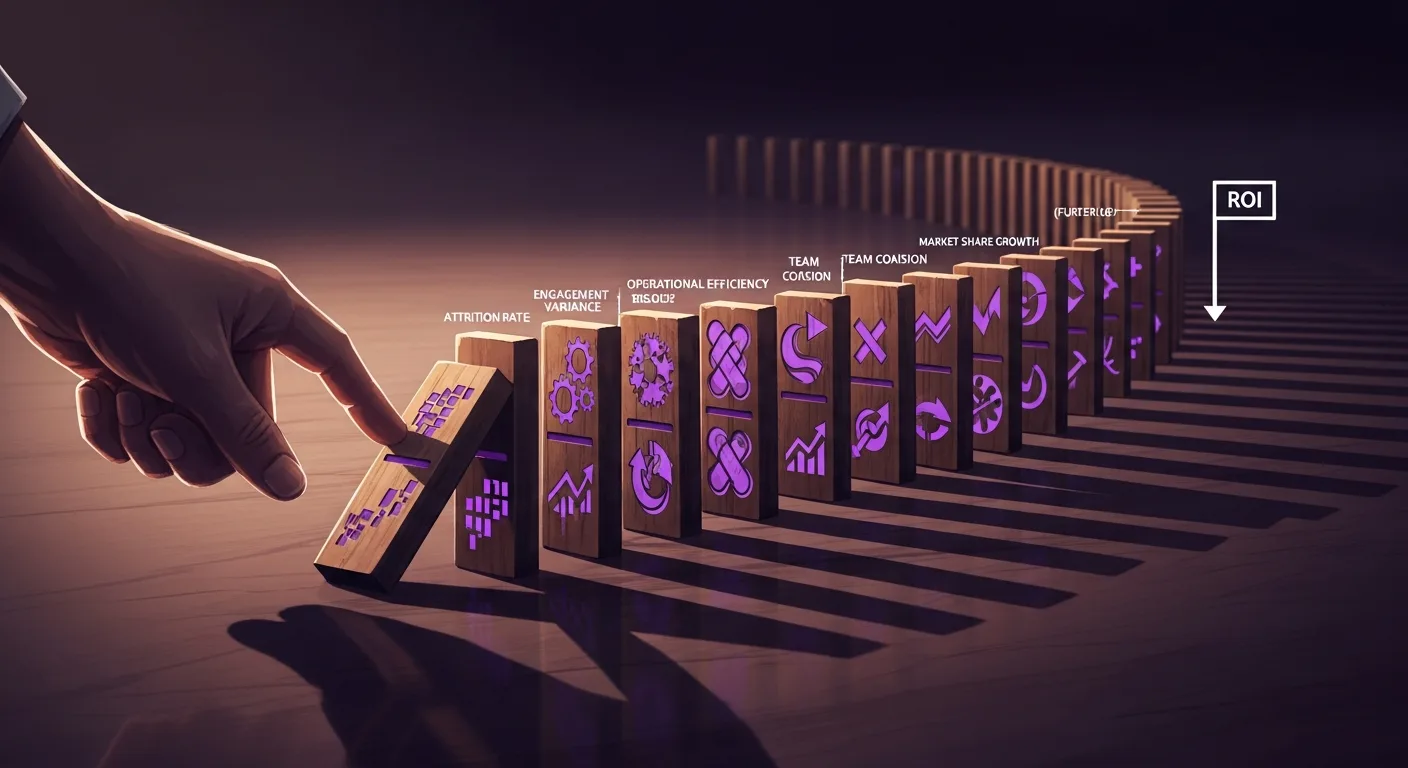
Treating ROI as a single number. The ROI of virtual team building isn't one figure; it's a chain. Participation rate (Stage 3) feeds engagement delta (Stage 4 pulse) which feeds retention delta (Stage 4 HRIS) which gets multiplied by cost-per-departure to produce the dollar figure. Showing only the dollar figure invites Finance to question it. Showing the chain invites Finance to debate which link is weak — and that's the conversation you want to have, because every link is defensible on its own.
Forgetting that customization shifts both engagement and the ROI narrative. Generic events with no customization are easier to discount in a renewal review as "we bought a vendor experience." Adding NPC, Logo, or Story customization (each a flat add-on) gives you a more defensible "we ran our own program" framing. When we ran Coca-Cola HBC's LearnFest 2021 closing event for 6,000 employees across 28 countries, the customization layer was what let the event sit inside the broader LearnFest brand rather than next to it. That distinction matters when leadership reviews the spend nine months later.
Trying to ROI-justify a one-off event. ROI sustainability requires cadence. A single quarterly Marathon won't move the trailing twelve-month attrition figure on its own. Three or four across a year, ideally bracketing recognized engagement risk windows (post-reorg, post-layoff, pre-budget-cycle), produce the longitudinal data the ROI case actually needs. Plan the second event before you've finished measuring the first, or the cadence breaks.
What the research backs

The financial picture for engagement and retention has gotten sharper over the past two years. McKinsey Quarterly's September 2023 research found that employee disengagement and attrition cost a median S&P 500 company $228 million to $355 million annually in lost productivity, totaling $1.1 billion+ over five years. The same study identified that only 4% of employees are "thriving stars" delivering disproportionate value, and those thriving stars cluster in distributed work: 45% remote, 36% hybrid, 19% in-person. That distribution describes top performers specifically, not the workforce as a whole. The takeaway for the ROI framework: distributed-team engagement isn't only a defensive retention play; it's where your most disproportionately valuable people are working from.
Deloitte's 2024 Burnout in the Workplace research adds the wellness angle to the calculation. Workers attending two or more company-sponsored events per quarter report 23% lower burnout symptoms, and 31% of professionals named "lack of recognition" as their primary burnout driver — overtaking workload for the first time in 2024. The cadence implication for ROI is direct: you can't fix burnout-driven attrition with one event. Quarterly programs cross the threshold the research identifies. One-offs don't, and trying to ROI-justify a single event against burnout outcomes will produce a thin case.
Microsoft's 2024 Work Trend Index, surveying 31,000+ workers across 31 countries, found that 57% of distributed workers would prefer async-engagement options to live ones. That's one of the strongest format-decision signals we have. If more than half your distributed team would rather engage async, forcing live attendance damages your participation rate, which damages your proof footprint, which damages the ROI calculation downstream. Marathon's design assumption (async-by-default with a leaderboard creating pull) maps onto this stated preference directly, which is part of why its completion rates hold up where forced-live events crater.
For the academic backstop, Anog et al. (SSRN, 2023) conducted a systematic review of 60+ studies and found that structured team-building activities increase satisfaction and reduce turnover — with effects amplified when integrated into a broader development strategy rather than run as isolated one-off moments. The directional relationship between investment and retention is solid; the magnitude depends on the cadence and the integration. That's the case for treating virtual team building as a programmatic spend, not a discretionary line item, and it's the line of argument we keep coming back to in renewal conversations.
Layered on top of the third-party research is our own data from 1,500+ events. Marathon completion rates of 65-to-78% at 500+ companies. Big Game scaling cleanly to 10,000 players in a single session. A standing pattern in our portfolio: the by-team analytics at the manager level move first, then the broader team-level engagement scores, then 60-to-90 days later the retention numbers in that cohort. The chain repeats. The first time you see it run end to end at your own company is when ROI stops being a phrase you have to defend and starts being a number Finance asks you to keep producing.
Frequently asked questions
How do you calculate the ROI of a virtual team building event in dollars?
Start with SHRM's 2024 cost-per-hire benchmark of fifteen to twenty-one thousand dollars per non-executive departure, then multiply by the voluntary departure count in your at-risk tenure band — usually 6-to-18 months. A twenty-thousand-dollar event that prevents two departures in that cohort breaks even on the spreadsheet alone. The chain you want to show Finance: event participation rate, engagement-score delta, retention delta in the affected cohort, then dollars-per-retained-employee multiplied through. Every link in the chain is defensible separately.
What's a realistic ROI percentage I should expect from a single virtual team building event?
Single events rarely produce a clean ROI percentage you can publish. The honest answer for a first event is "directional improvement in the participation cohort, with a measurable engagement-pulse delta at 60 days." The ROI percentage stabilizes around the third or fourth event in a programmatic cadence, where the cumulative retention delta in the at-risk cohort starts to read against your baseline. Promising a specific ROI figure off one event is the fastest way to lose the Finance audience.
Which format generates better ROI data — Big Game or Marathon?
They answer different problems. Big Game produces one clean shared-energy event with one participation rate, one NPS, one leaderboard, and a contained data envelope. Marathon spreads engagement across 1-to-5 days, producing daily participation data, episode-level NPS pulses, and by-team completion breakdowns. For the ROI conversation, Marathon's denser data is usually the stronger proof footprint — but Big Game wins when you need a single defensible event score for a kickoff or holiday moment. Match the format to which numbers Finance will eventually ask about.
How long after the event should I measure ROI?
The event-level proof signal is captured at 24 hours: participation rate, NPS by team, engagement breakdown. The retention signal needs 60-to-90 days of HRIS data to show meaningful movement in the affected cohort. Anything sooner conflates participation enthusiasm with retention impact. Anything later loses the through-line to the event. The standing rhythm we recommend: file the 24-hour analytics, then schedule the 60-to-90-day HRIS comparison in your calendar before you've even shipped the post-event email.
Does customization (NPC, Logo, Story) materially affect the ROI calculation?
Yes, in two ways. Customization adds direct production cost (each tier is a flat add-on rather than a per-player scaler) which lifts the program's denominator. But it tends to lift event NPS by a meaningful margin and meaningfully improves the renewal narrative — a customized event reads to leadership as "our program" rather than "we bought a vendor." For a recurring program where renewal is the long-term ROI lever, the customization spend often pays for itself in renewal probability alone. The breakdown lives on our pricing page.